 This statistic gives information on Facebook's advertising revenue in the United States and outside the United States from 2014 to 2018. In 2015, Facebook's U.S. advertising revenue was 8.03 billion U.S. dollars, compared to 9.05 billion U.S. dollars of international ad revenues.
- Internet›
- Advertising & Marketing›
Facebook: U.S. vs non-U.S. advertising revenue worldwide 2014-2018
Facebook's U.S. and non-U.S. advertising revenue from 2014 to 2018 (in billion U.S. dollars)
This statistic gives information on Facebook's advertising revenue in the United States and outside the United States from 2014 to 2018. In 2015, Facebook's U.S. advertising revenue was 8.03 billion U.S. dollars, compared to 9.05 billion U.S. dollars of international ad revenues.
Loading statistic...
| Non-US | US | Worldwide | |
|---|---|---|---|
| 2014 | 6.21 | 5.29 | 11.49 |
| 2015 | 9.05 | 8.03 | 17.08 |
| 2016* | 12.08 | 10.29 | 22.37 |
| 2017* | 15.49 | 12.68 | 28.17 |
| 2018* | 18.95 | 14.89 | 33.84 |
| Non-US | US | Worldwide | |
|---|---|---|---|
| 2014 | 6.21 | 5.29 | 11.49 |
| 2015 | 9.05 | 8.03 | 17.08 |
| 2016* | 12.08 | 10.29 | 22.37 |
| 2017* | 15.49 | 12.68 | 28.17 |
| 2018* | 18.95 | 14.89 | 33.84 |
About this statistic
Show source
Download
Settings
Share
Download started
Please be patient - this may take a moment
Please be patient - this may take a moment
Description
Source
More information
This statistic gives information on Facebook's advertising revenue in the United States and outside the United States from 2014 to 2018. In 2015, Facebook's U.S. advertising revenue was 8.03 billion U.S. dollars, compared to 9.05 billion U.S. dollars of international ad revenues.
Show more- Show sources information
- Show publisher information
- Release date
- April 2016
- Region
- Worldwide
- Survey time period
- 2014 to 2015
- Supplementary notes
-
* Forecast
Paid advertising only; excludes spending by marketers that goes towards developing or maintaining a Facebook presence
More information
- Region
- Worldwide
- Survey time period
- 2014 to 2015
- Supplementary notes
-
* Forecast
Paid advertising only; excludes spending by marketers that goes towards developing or maintaining a Facebook presence
Other interesting statistics


Facebook: number of monthly active users worldwide 2008-2018


Facebook: distribution of global audiences 2018, by age and gender
 +
+ +
+Facebook: advertising revenue worldwide 2009-2017


Most popular product brands on Facebook 2018
 +
+ +
+Social media platforms used by marketers worldwide 2018
 +
+ +
+Facebook advertising CPM in selected countries worldwide as of March 2018
Statista Accounts: Access All Statistics. Starting from $588 / Year
Basic Account
Get to know the platform
You only have access to basic statistics.
Premium Account
Your perfect start with Statista
- Instant access to 1m statistics
- Download in XLS, PDF & PNG format
- Detailed references
$49 / Month *
Corporate Account
Full access
Corporate solution including all features.
* All products require an annual contract.
Prices do not include sales tax
(New York residents only).
Prices do not include sales tax
(New York residents only).
Leading companies trust Statista:
Related Studies: Available to Download in PDF or PPTX Format

All Information
in one Presentation
Facebook marketing
- 141 page/s
- English
- pptx
- Detailed references
Everything On "Facebook marketing " in One Document: Edited and Divided into Handy Chapters. Including Detailed References.
Statista has been my savior on several occasions. The site is easy to maneuver and the data is in a format that can go right into a report or presentation.Marlene Greenfield
Vice President, Hearst Magazines

Statistics on "Facebook marketing "
- Adoption
The most important statistics
- Leading social media used for professional purposes according to marketing professionals worldwide as of February 2017Social media marketers use for professional purposes worldwide 2017
- Leading social media platforms used by marketers worldwide as of January 2018Social media platforms used by marketers worldwide 2018
- Most important social media platforms for marketers worldwide as of January 2018Most important social media platforms for marketers worldwide 2018
- Facebook marketing usage rate in the United States from 2013 to 2017Use of Facebook as a marketing channel in the U.S. 2013-2016
- Number of active advertisers on Facebook from 1st quarter 2016 to 1st quarter 2018 (in millions)Number of active advertisers on Facebook 2016-2018
- Facebook ad adoption by U.S. businesses in 2016, by advertiser typeFacebook ad adoption by U.S. businesses 2016, by industry
- Social media platforms used by B2C marketers in North America as of July 2017Usage of social media platforms for B2C content marketing in North America 2017
- Social media used by B2B marketers in North America from 2011 to 2017Social media used by B2B marketers in North America 2011-2017
- Budgets and investments
The most important statistics
- Digital marketing spending in the United States from 2014 to 2019, by segment (in billion U.S. dollars)U.S. digital marketing spending growth 2014-2019, by segment
- Change in digital advertising spending on selected social media in the United States in August 2016Change in digital ad spend in the U.S. 2016, by social media
- Leading types of paid content distribution methods used by B2B marketers in North America as of July 2018Paid methods used for content distribution by B2B marketers in North America 2018
- Leading channels, technologies and services marketers are planning to invest in as of December 2016U.S. marketing channel investment priorities 2017
- Share of local businesses using Facebook for advertising and promotions in the United States in 3rd quarter 2016U.S. SMBs Facebook marketing usage 2016
- Distribution of health care companies' marketing budgets in the United States in 2017, by channelU.S. health care companies: distribution of marketing budget 2017, by channel
- Average cost per click (CPC) on Facebook in selected countries as of 4th quarter 2017 (in U.S. dollars)CPC on Facebook in selected countries in Q4 2017
- Usage
The most important statistics
- Distribution of Facebook advertising campaign objectives worldwide as of March 2018Share of Facebook advertising campaign objectives worldwide 2018
- Number of Facebook interactions per brand post from January to July 2017Facebook reactions to brand posts 2017
- Number of Facebook interactions per brand post as of July 2017, by profile sizeFacebook reactions to brand posts 2017, by profile size
- Leading types of branded posts on Facebook worldwide as of August 2017, by formatLeading Facebook brand post formats 2017
- Most popular types of content posted by brands on Facebook as of September 2016Facebook brand post content share 2016
- Percentage of brands with Facebook Messenger features as of November 2016, by verticalBrand Facebook Messenger feature usage 2016, by vertical
- Average number of monthly video posts by brands to Facebook from January to July 2017Facebook: monthly video posts by brands 2017
- Average length of Facebook video from leading news publishers on Facebook as of February 2017 (in seconds)Facebook video length of leading global news publishers 2017
- Cost & effectiveness
The most important statistics
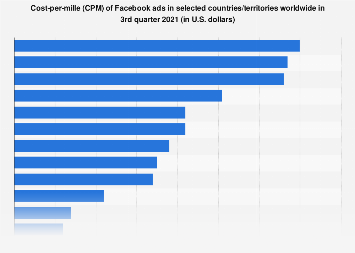
- Facebook advertising average cost-per-mille (CPM) in selected countries worldwide as of March 2018 (in U.S. dollars)Facebook advertising CPM in selected countries worldwide as of March 2018
- Change in Facebook advertising cost-per-mille (CPM) worldwide from January 2017 to February 2018Facebook CPM growth worldwide 2017-2018
- Change in Facebook advertising cost-per-click (CPC) worldwide from January 2017 to February 2018Facebook CPC growth worldwide 2017-2018
- Average cost-per-mille (CPM) of Facebook advertising campaigns worldwide as of March 2018, by objective (in U.S. dollars)Average CPM of Facebook advertising campaigns 2018, by objective
- Advertising metrics for Facebook from 3rd quarter 2013 to 4th quarter 2017Facebook: advertising metrics 2013-2017
- Leading digital publishers in the United States as of July 2018, based on audience size (in millions)Top digital publishers in the U.S. 2018, by audience
- Most effective digital marketing tactics worldwide in March 2016Most effective digital marketing tactics worldwide 2016
- Share of global marketers who agree that their Facebook marketing is effective as of January 2018Effectiveness of Facebook marketing worldwide 2017
- Facebook ad revenue
The most important statistics
- Facebook's advertising revenue worldwide from 2009 to 2017 (in million U.S. dollars)Facebook: advertising revenue worldwide 2009-2017
- Worldwide mobile advertising revenue of Facebook from 2013 to 2021 (in million U.S. dollars)Facebook: global mobile advertising revenue 2013-2021
- Worldwide video advertising revenue of Facebook from 2015 to 2021 (in million U.S. dollars)Facebook: global video advertising revenue 2015-2021
- Instagram's net mobile advertising revenue as percentage of Facebook's mobile advertising revenue from 2015 to 2018Instagram: Facebook advertising revenue share 2015-2018
- Facebook's U.S. and non-U.S. advertising revenue from 2014 to 2018 (in billion U.S. dollars)Facebook: U.S. vs non-U.S. advertising revenue worldwide 2014-2018
- Net digital display ad revenue in the United States from 2016 to 2019, by company (in billion U.S. dollars)Digital display ad revenue in the U.S. 2016-2019, by company
- Net mobile advertising revenue in the United States from 2016 to 2019, by companyU.S. mobile ad revenue share 2016-2019, by company
- Audience & customer engagament
The most important statistics
- Number of monthly active Facebook users worldwide as of 3rd quarter 2018 (in millions)Facebook: number of monthly active users worldwide 2008-2018
- Distribution of Facebook users worldwide as of October 2018, by age and genderFacebook: distribution of global audiences 2018, by age and gender
- Leading countries based on share of Facebook users worldwide as of January 2018Countries with biggest Facebook user share 2018
- Share of consumers who felt annoyed by Facebook advertising in the United States as of May 2017U.S. consumers who find Facebook advertising annoying 2017
- Share of consumers who found Facebook advertising to be helpful in the United States as of May 2017U.S. consumers who find Facebook advertising helpful 2017
- Share of Facebook users in the United States who use social media for brand research as of 3rd quarter 2016, by age groupSocial media usage for brand research among U.S. Facebook users 2016, by age group
- Favorite social platforms to engage with brand content according to female social media users in the United States as of February 2016Top platforms to engage with brand content among U.S. women 2016
- Leading reasons why social media users have followed brands on social media worldwide as of July 2016Leading reasons to follow brands on social media worldwide 2016
- Leader rankings
The most important statistics
- Biggest publishers on Facebook as of September 2018, ranked by total Facebook interactions (in millions) Facebook user engagement of leading publishers 2018
- Technology brands with the most Facebook fans as of April 2018 (in millions)Most popular technology brands on Facebook 2018
- Product brands with the most Facebook fans as of April 2018 (in millions)Most popular product brands on Facebook 2018
- Retail brands with the most Facebook fans as of June 2018 (in millions)Most popular retail brands on Facebook 2018
- Leading apparel brands with the most Facebook fans as of January 2019 (in millions)Facebook: number of fans of popular apparel brands 2019
- Leading beauty brands with the most followers on Facebook as of January 2019 (in millions)Facebook: number of followers of popular beauty brands 2019
- Leading media publishers in the United States as of 2nd quarter 2016, by Facebook visits (in millions)Top media publishers in the U.S. 2016, by Facebook referral traffic
Popular Related Keywords
Need help with using Statista for your research? Tutorials and first steps
Further Content: Statistics, Studies, and Topic Pages
Statistics
- U.S. Twitter advertising revenue 2015-2018
- Twitter: non-U.S. advertising revenue 2010-2015
- U.S. advertising revenues of social networks 2015-2018
- Media companies: ad revenues 2017
- U.S. LinkedIn social network advertising revenue share 2015-2018
- Facebook CTR in higher education advertising in the U.S. 2018, by program
- Facebook CPL in higher education advertising in the U.S. in 2018, by program
- LinkedIn's ad revenue 2011-2015
- Digital and print advertising revenue of U.S. newspapers 2003-2014
- Advertising market in Australia 2016 and 2021 by platform
- MySpace - advertising revenue in the U.S.
- Digital display ad revenue growth in the U.S. 2016-2019, by company
- Canada: ad revenue 2011-2014, by medium
- Advertising revenue of internet media China 2016, by company
- Twitter: U.S. desktop advertising revenue 2012-2015
- Production value of advertising & market research industry in Lithuania 2008-2015
- Scripps Networks global ad revenue 2014-2017
- Net revenue of advertising papers in Germany from 1985 to 2017
- Advertisement revenue in MENA by platform 2016
- Global legal and illegal computer software 2009-2017
Studies
- Advertising in Italy
- Advertising in the Netherlands
- Advertising in Europe
- Advertising in the United Kingdom (UK)
- Digital advertising in Europe
- Global Mobile Advertising Revenue 2016
- Twitter in the United Kingdom (UK)
- Facebook User-Generated Content Benchmark Report 2017
- Advertising market in the U.S.
- Advertising worldwide
- Twitter marketing
- Media in Mexico
- Advertising in Belgium
- Media in Chile
- Facebook
Statistics on the topic
Free statistics
- Number of active advertisers on Facebook from 1st quarter 2016 to 1st quarter 2018 (in millions)
- Average cost per click (CPC) on Facebook in selected countries as of 4th quarter 2017 (in U.S. dollars)
- Number of Facebook interactions per brand post as of July 2017, by profile size
- Leading types of branded posts on Facebook worldwide as of August 2017, by format
- Average number of monthly video posts by brands to Facebook from January to July 2017
- Worldwide mobile advertising revenue of Facebook from 2013 to 2021 (in million U.S. dollars)
- Instagram's net mobile advertising revenue as percentage of Facebook's mobile advertising revenue from 2015 to 2018
- Facebook's U.S. and non-U.S. advertising revenue from 2014 to 2018 (in billion U.S. dollars)
- Number of monthly active Facebook users worldwide as of 3rd quarter 2018 (in millions)
- Distribution of Facebook users worldwide as of October 2018, by age and gender
- Leading countries based on share of Facebook users worldwide as of January 2018
- Share of Facebook users in the United States who use social media for brand research as of 3rd quarter 2016, by age group
- Favorite social platforms to engage with brand content according to female social media users in the United States as of February 2016
- Technology brands with the most Facebook fans as of April 2018 (in millions)
- Product brands with the most Facebook fans as of April 2018 (in millions)
- Retail brands with the most Facebook fans as of June 2018 (in millions)
- Leading apparel brands with the most Facebook fans as of January 2019 (in millions)
- Leading beauty brands with the most followers on Facebook as of January 2019 (in millions)
- Twitter's advertising revenue in the United States from 2015 to 2018 (in billion U.S. dollars)
- Twitter's advertising revenue outside the United States from 2011 to 2015 (in million U.S. dollars)
- Social network advertising revenues in the United States from 2015 to 2018 (in billion U.S. dollars)
- Social networking ad revenue market share of LinkedIn in the United States from 2015 to 2018
- Digital and print advertising revenue of U.S. newspapers from 2003 to 2014 (in billion U.S. dollars)
- Twitter's desktop advertising revenue in the United States from 2012 to 2015 (in million U.S. dollars)
- Annual production value of the advertising and market research industry in Lithuania from 2008 to 2015 (in million euros)
Premium Statistics
- Leading social media used for professional purposes according to marketing professionals worldwide as of February 2017
- Leading social media platforms used by marketers worldwide as of January 2018
- Most important social media platforms for marketers worldwide as of January 2018
- Facebook marketing usage rate in the United States from 2013 to 2017
- Facebook ad adoption by U.S. businesses in 2016, by advertiser type
- Social media platforms used by B2C marketers in North America as of July 2017
- Social media used by B2B marketers in North America from 2011 to 2017
- Share of local businesses using Facebook for advertising and promotions in the United States in 3rd quarter 2016
- Primary social media platforms used by social influencers for brand collaborations worldwide as of January 2018
- Digital marketing spending in the United States from 2014 to 2019, by segment (in billion U.S. dollars)
- Change in digital advertising spending on selected social media in the United States in August 2016
- Leading types of paid content distribution methods used by B2B marketers in North America as of July 2018
- Leading channels, technologies and services marketers are planning to invest in as of December 2016
- Distribution of health care companies' marketing budgets in the United States in 2017, by channel
- Distribution of Facebook advertising campaign objectives worldwide as of March 2018
- Number of Facebook interactions per brand post from January to July 2017
- Most popular types of content posted by brands on Facebook as of September 2016
- Percentage of brands with Facebook Messenger features as of November 2016, by vertical
- Average length of Facebook video from leading news publishers on Facebook as of February 2017 (in seconds)
- Leading header bidders used by publishers in the United States as of November 2017
- Most popular advertising software development kits (SDKs) used by Android gaming and non-gaming apps in 1st half 2017, by share of voice
- Facebook advertising average cost-per-mille (CPM) in selected countries worldwide as of March 2018 (in U.S. dollars)
- Change in Facebook advertising cost-per-mille (CPM) worldwide from January 2017 to February 2018
- Change in Facebook advertising cost-per-click (CPC) worldwide from January 2017 to February 2018
- Average cost-per-mille (CPM) of Facebook advertising campaigns worldwide as of March 2018, by objective (in U.S. dollars)
- Advertising metrics for Facebook from 3rd quarter 2013 to 4th quarter 2017
- Leading digital publishers in the United States as of July 2018, based on audience size (in millions)
- Most effective digital marketing tactics worldwide in March 2016
- Share of global marketers who agree that their Facebook marketing is effective as of January 2018
- How do you assess the effectiveness of the following social media platforms for B2C marketing?
- Best performing brands in terms of consumer engagement vis-a-vis expectations in their respective categories in the United States in 2017
- Facebook's advertising revenue worldwide from 2009 to 2017 (in million U.S. dollars)
- Worldwide video advertising revenue of Facebook from 2015 to 2021 (in million U.S. dollars)
- Net digital display ad revenue in the United States from 2016 to 2019, by company (in billion U.S. dollars)
- Net mobile advertising revenue in the United States from 2016 to 2019, by company
- Share of consumers who felt annoyed by Facebook advertising in the United States as of May 2017
- Share of consumers who found Facebook advertising to be helpful in the United States as of May 2017
- Leading reasons why social media users have followed brands on social media worldwide as of July 2016
- Appreciation of personalized recommendations on selected online platforms according to consumers in the United States as of May 2017
- Share of consumers who frequently notice sponsored content in selected media in the United States as of May 2017
- Leading brand actions on social media that prompt users in the United States to unfollow brand pages worldwide as of July 2016
- Types of advertising and promotions that consumers in the United States are willing to receive via Facebook Messenger as of 2016, by age group
- Biggest publishers on Facebook as of September 2018, ranked by total Facebook interactions (in millions)
- Leading media publishers in the United States as of 2nd quarter 2016, by Facebook visits (in millions)
- Advertising revenue generated by selected media companies in 2017 (in billion U.S. dollars)
- Facebook clickthrough rate (CTR) in higher education advertising in the United States as of March 2018, by program
- Facebook cost-per-like (CPL) in higher education advertising in the United States as of March 2018, by program (in U.S. dollars)
- LinkedIn's advertising revenue from 2011 to 2015 (in million U.S. dollars)
- Advertising spending in Australia in 2016 and 2021, by platform (in billion Australian dollars)
- MySpace advertising revenue in the U.S. in 2009 and 2010 and forecasts to 2012 (in million U.S. dollars)
- Change in net digital display ad revenue in the United States from 2016 to 2019, by company
- Distribution of advertising revenue in Canada from 2011 to 2014, by medium
- Revenue of the internet media from advertising in China in 2016, by company (in billion yuan)
- Scripps Networks Interactive advertising revenue worldwide from 2014 to 2017 (in billion U.S. dollars)
- Net advertisement revenue of advertising papers in Germany from 1985 to 2017 (in million euros)
- Revenue for advertising in the Middle East and North Africa in 2016, by media platform (in million U.S. dollars)
- Global share of legal and illegal computer software installed from 2009 to 2017
Statista Accounts: Access All Statistics. Starting from $588 / Year
Topics
About Statista
Statista offers dossiers and reports on over 170 industries. With Statista you are always able to make informed decisions and boost your work efficiency.
Internet & Telecommunications
- Social Media
- E-Commerce
- Online Video & Entertainment
- Advertising & Marketing
Consumer Goods & FMCG
- Alcoholic Beverages
- Cleaning Products
- Cosmetics & Personal Care
- Food & Nutrition
Retail & Trade
- Health & Hygiene
- International Trade
- Shopping Behavior
- Sports & Leisure
Travel, Tourism & Hospitality
- Business Travel
- Leisure Travel
- Accomodation
- Restaurants
Society
- Demographics
- Economy
- Education & Science
- Politics & Government
Transportation & Logistics
- Aviation
- Rail Transport
- Vehicles & Road Traffic
- Water Transport
Please log in to access our additional functions
Register in seconds and access exclusive features.
Basic Account |
Instant Access
Premium Account | ||
|---|---|---|---|
Our servicesClick the question mark for further information | Free |
$49 per month* | |
| Basic statistics | |||
| Premium statistics | |||
|
Graph download
| |||
| Download PDF | |||
|
Excel download
| |||
| Register | Purchase now | ||
*Duration: 12 months, billed annually, single license
Yes, let me download!
...and make my research life easier.
Exclusive Corporate feature
This feature is limited to our corporate solutions.
Please contact us to get started with full access to dossiers, forecasts, studies and international data.
Corporate Account
News
News
Latest News

New
Exclusive data available through OAAA partnership
Statista releases new exclusive OOH advertising data from the Outdoor Advertising Association of America (OAAA).

New
New Topic: No-deal Brexit
On January 15, 2019 the British Parliament is set to vote on Theresa May’s Brexit deal. The vote is perilously close to the departure date of March 29, and should it be rejected, a no-deal Brexit is the default scenario. This topic looks at the implications that a no-deal Brexit could have on the UK
New
E-Commerce Spain: Online Stores Ranking Update
Did you know that the top 3 online stores in Spain achieved a market share of over 20 percent in 2017? Understand the e-commerce market in Spain and get to know the top online stores. eCommerceDB offers detailed online store profiles with key data on the largest ecommerce players worldwide.

New
European Banking Sector
This extended statistical dossier takes an in-depth look at the current health of the European banking sector as well as its ability to meet the demands of a digital future.

New
New Dossier: Latin American Online Shopping Events
With consistent growth in recent years, e-commerce is rapidly becoming a part of the shopping culture in Latin America. Often offering important discounts, online shopping events represent a major push to online sales in the region.

Updated
Updated Brexit analysis available now!
Statista has updated its outline of potential impacts of the Brexit on UK industries, which is included in our 41 UK Industry Reports. Furthermore, the reports feature statistics, forecasts, survey results, and analyses in a form that is easy to read and adopt.

New
New Dossier: Digital Marketing in Italy
Italian enterprises invest significantly in digital marketing to enhance their presence, yet the potential strategies to follow are extremely diverse. This dossier presents key aspects of the industry according to professionals and marketers, including new trends in content and e-mail marketing.

New
Statista European Football Benchmark
The European Football Benchmark compares the big 5 European leagues. Find out which league and club have the largest foreign fan potential? Who are the biggest stars? And how expensive it is to be a fan? Read all this and more with Statista’s report: “European Football Benchmark – the big 5 leagues”

New
New metric unit: Payments in eCommerce
The payment options available for eCommerce customers have long moved beyond simple cash or card payments. The Digital Market Outlook now offers an analysis of payment methods used by customers in online shopping in 50 countries and forecasts for this metric unit up to 2023.

New
New Dossier: Foreign conflicts of Saudi Arabia
Recently, the kingdom of Saudi Arabia has faced some foreign political challenges with its Middle Eastern neighbors. The kingdom's current conflicts with Yemen, Iran, Qatar, and Turkey are all different in their nature, however, they all bear consequences for the geopolitical dynamic of the region.

New
New Dossier: Fintech in Italy
The Fintech sector in Italy is developing steadily. Thanks to young entrepreneurs and new platforms, Fintech is gaining recognition as an alternative and as a complement to the traditional financial system. This dossier presents an overview about the scale and ambitions of this innovative sector.

New
Statista survey on the U.S. motorcycle market
With a market share of 31% Harley-Davidson is the top-dog on the U.S motorcycle market. On top of that the U.S. manufacturer can prevail against the competition in terms of customer loyalty and brand image. Find out which brands come close to the market leader in the Statista motorcycle Report.

Updated
Updated Industry Reports France available now!
Statista has updated its 41 Industry Reports for France with the most recent data. They feature statistics, forecasts, survey results, and analyses in a form that is easy to read and adopt. Understand and assess industries with a report that includes the most important key figures!

New
New Study: The Brexit Factbook
With the UK set to leave the EU in March next year and negotiations stalling, the chance of a no-deal Brexit is increasing. The Brexit Factbook combines the most important statistics about the UK exiting the EU from the lead-up to the referendum to the economic, financial and political consequences.

New
New Dossier: Avocado market in Latin America
Latin America is one of the main regions producing avocados, a large share of which are exported to the U.S. and Europe. This dossier provides key information about the avocado’s agricultural production, cultivation area, imports and exports in countries such as Brazil, Mexico, Chile, and Colombia.
We use cookies to personalize contents and ads, offer social media features, and analyze access to our website. In your browser settings you can configure or disable this, respectively, and can delete any already placed cookies. For details, please see your browser’s Help section (by pressing F1). Please see our privacy statement for details about how we use data.